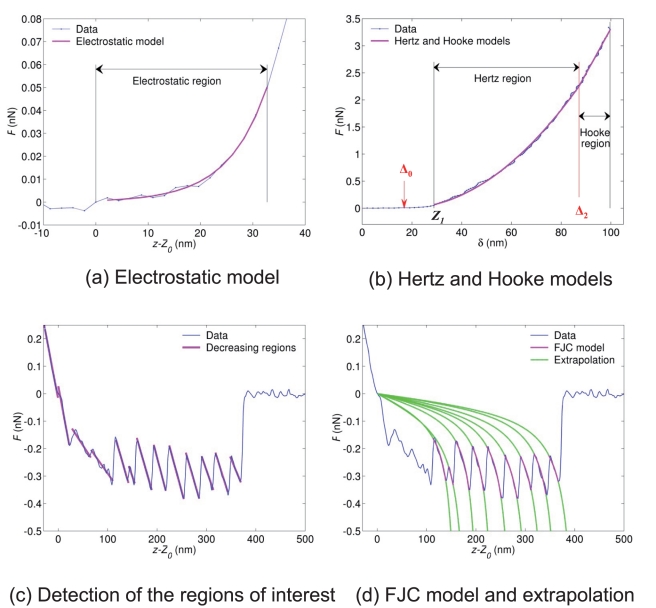
Figure 3. Detection of the regions of interest from the segmentation results and fitting to the physical models.
(a) Approach curve: both vertical lines correspond to the beginning ( ) and end (
 ) of the electrostatic regime. (b) Approach curve, Hertz and Hooke regimes. The red vertical line and red arrow correspond to the positions
  and
and  which are found by the optimization algorithm. The black line in between marks the
  -value
  for
for  (beginning of Hertzian regime). (c) Retraction curve: detection of the regions of interest (decreasing regions of the piecewise affine signal). (d) Fitting of the data to the FJC model in each region of interest. No fitting is performed in the first 100 nm after the contact point
  . For each region, the extrapolation of the FJC model outside the current region of interest is shown in green.

