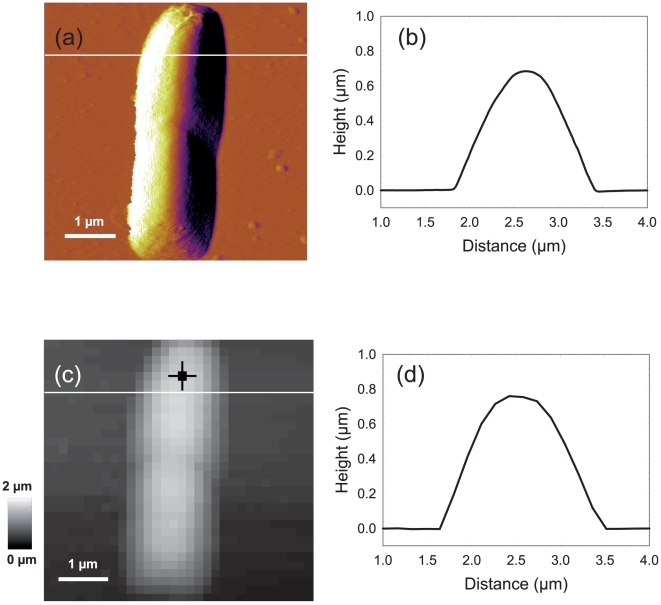
Figure 4. Comparison between deflection and Force Volume image resolution.
Deflection image (a) and reconstructed height image (c) of E. coli cells in buffer solution (1 mM KNO3). Figures 4b and 4d correspond to the height profiles measured along the cross section of Figure 4a and Figure 4c as indicated therein by white lines.

