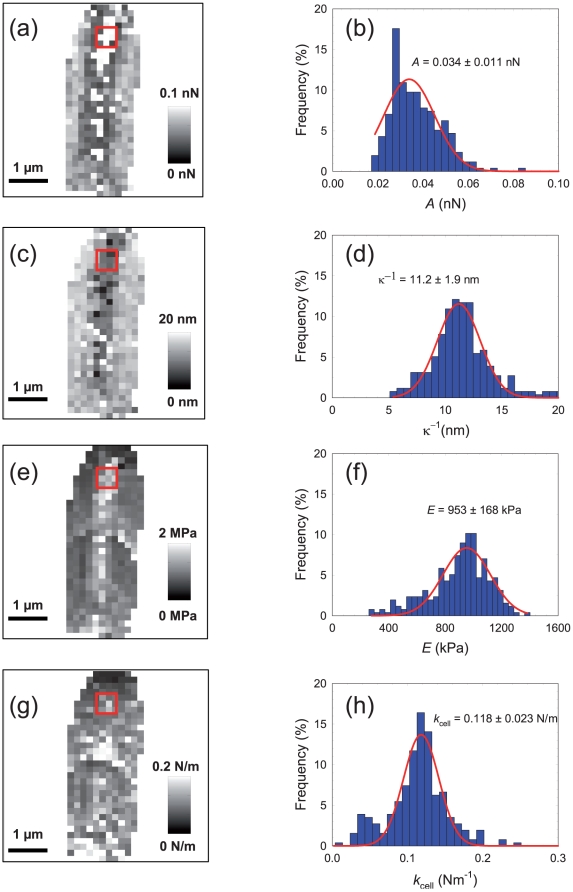
Figure 5. Physico-chemical properties of E. coli cells in buffer solution (1 mM KNO3).
(a) 2D map of electrostatic prefactor A (A-range = 0–0.1 nN). (b) Statistic distribution of electrostatic prefactor corresponding to 2D map in (a). (c) 2D map of the Debye length (κ−1-range = 0–20 nm). (d) Statistic distribution of the Debye length corresponding to 2D map in (c). (e) 2D map of the Young modulus (E-range = 0–2 MPa). (f) Statistic distribution of the Young modulus corresponding to 2D map in (e). (g) 2D map of the bacterial spring constant (k cell-range = 0–0.2 N/m). (h) Statistic distribution of the bacterial spring constant corresponding to 2D map in (g).

