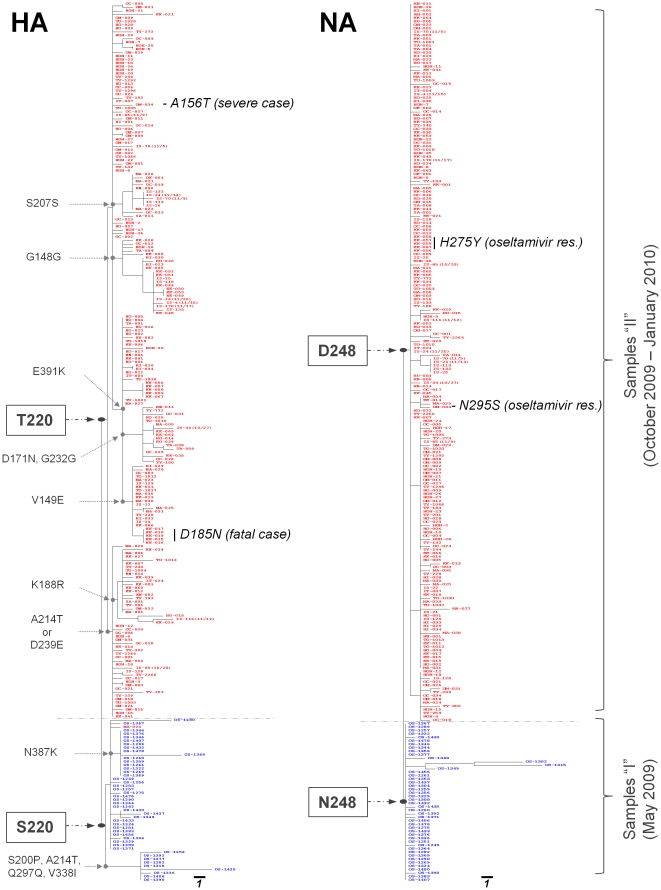
Figure 2. Maximum parsimony phylogenetic analysis with the partial sequences of HA and NA.
Phylogenetic trees have been created for HA (left panel) and NA (right panel) proteins based on the partial sequences of the 2009 pdm A(H1N1) influenza viruses in a total of 253 samples that had been collected in May 2009 (samples “I”) and during the period of October 2009 to January 2010 (samples “II”). Samples “I” and “II” are marked in blue and red, respectively. For both HA and NA, the phylogenetic trees demonstrate two distinct clusters represented by samples “I” and “II”. The major non-synonymous or synonymous mutations are indicated. The scale bars represent 1 base substitution per site.

