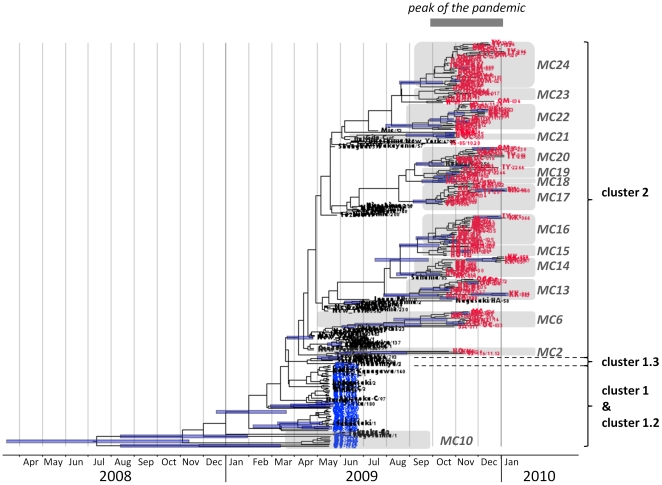
Figure 3. Bayesian MCMC inference with the concatenated HA and NA partial sequences of the 2009 pdm A(H1N1) influenza viruses.
A Bayesian MCMC tree was computed with the concatenated partial sequences of HA and NA from the 2009 pdm A(H1N1) influenza viruses from Japan and the rest of the world for the period between May 2009 and January 2010. The clusters are named according to reference 17. The names of the samples collected in this study are marked in blue for samples “I” and in red for samples “II”. The names of the sequences retrieved from the NCBI Influenza Virus Resource database (60 from Japan and 18 from the rest of the world) are marked in black. The micro-clades (MC) we found in this study are highlighted in grey. The horizontal axis represents the time. The highest posterior density intervals (95%) of the node heights are marked by a light blue bar.

