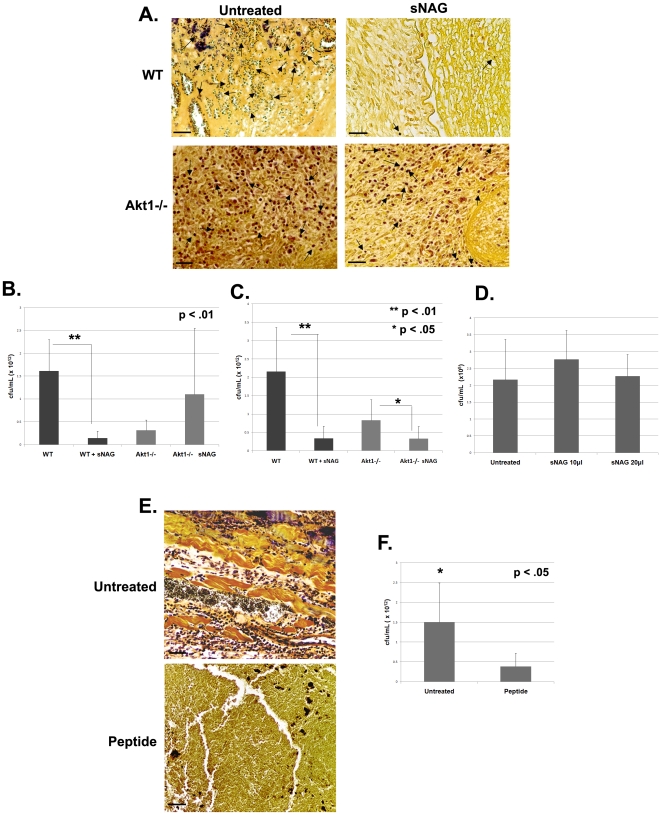
Figure 5. sNAG treatment reduces bacterial infection in an Akt1 dependent manner.
(A) Tissue gram staining of paraffin embedded S. aureus infected wounds from WT and Akt1null mice (n = 3). Infected wounds were either untreated or treated with sNAG membrane and wound beds were harvested on day 3 and day 5 for analysis. Dark purple staining indicates the presence of gram positive bacteria in the wound bed. Black arrows indicate examples of gram positive staining. Note the accumulation of positive staining in untreated WT that is lacking in WT animals treated with sNAG. Scale bars = 50 µm. (B) CFUs derived from day 5 post wounding were quantitated from S. aureus infected wounds using both treated and untreated WT (n = 3) and Akt1 mice (n = 3). Wild type mice that were sNAG treated show a significant (p<.01) decrease in bacteria load in the wound beds as compared to Akt1 null animals. All experiments were repeated three independent times and the p values are shown. (C) CFU quantitated from infected wounds at day 3 post wounding in a similar fashion described in (B). sNAG treatment of infected wounds shows a significant decrease in CFU of both WT and Akt1 null animals on day 3, but the WT animals show an approximate 10 fold difference compared to a 2 fold difference in Akt1 animals. (D) Quantitation of CFUs in S. aureus cultures that were either untreated or treated with various amounts of sNAG nanofibers. Each experiment was performed three independent times and p values are shown. (E) Tissue gram staining of S. aureus infected wounds harvested on day 3 post wound from WT mice (n = 3) that were treated with or without β-defensin 3 peptide. Note the decrease in gram positive staining in infected wounds that were treated with β-defensin 3 peptide. (F) Quantitation of CFUs from S. aureus infected WT mice (n = 3) treated with or without β-defensin 3 peptide. Infected wounds that were treated with peptide show a significant decrease (p<.05) in CFU. Scale bars = 50 µm. Each experiment was performed three independent times and p values are shown.

