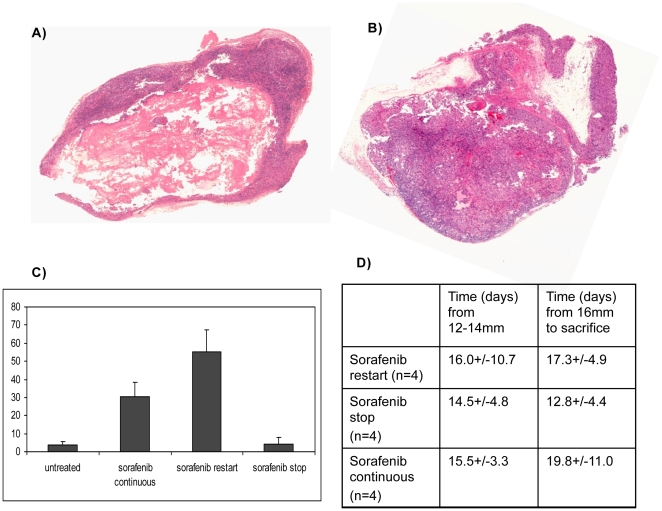
Figure 4. Pathologic analysis of A498 tumors receiving two different regimens of sorafenib.
Representative H&E stain showing tumor necrosis in a tumor from a mouse treated with sorafenib at 12 mm and in which sorafenib was stopped when the tumor became resistant (14 mm) and then restarted after the tumor increased from 14 to 16 mm (A: sorafenib restart) and a tumor from a mouse in which sorafenib was started and stopped at the same timepoints but not restarted on therapy at 16 mm (B: sorafenib stop) is shown. Both specimens were harvested when tumors reached 20 mm. The area of necrosis (N) is much more prominent in the tumor in which sorafenib was restarted and this was quantitated and shown in C (N = 3–4 for each arm; P = 0.0027). D shows the timing of growth of the tumors from the 3 arms.

