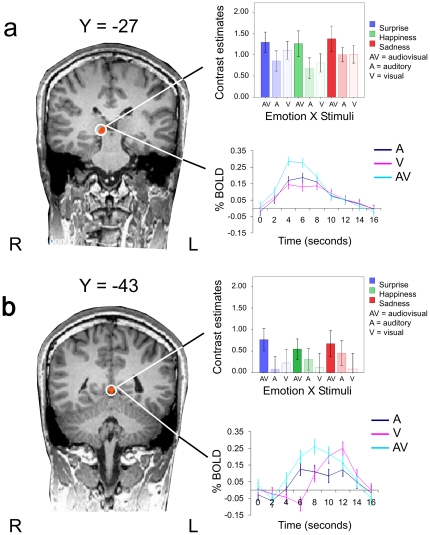
Figure 3. The coronal slices show the right thalamus and right culmen activation at two y Talairach co-ordinates.
Activation assessed in Experiment 1 by contrasting the brain response for the audiovisual displays with that for the auditory– and visual–only displays: (AV>A)∩(AV>V). (a) The averaged contrast estimates for the audiovisual, auditory and visual conditions are reported separately for the three emotional categories (sadness, happiness, and surprise). The audiovisual emotional conditions (thalamus: mean = 1. 309±0.248; culmen: 0.661±0.242) activated these areas more than either the auditory (thalamus: mean = 0.844±0.155; culmen: 0.279±0.248) or visual conditions (thalamus: mean = 0.974±0.168; culmen: 0.143±0.316), similarly for all the portrayed emotions. (b) Event-related bold signals are shown for auditory (red), visual (green) and audiovisual (blue). The error bars represent the standard error of the mean. L = left hemisphere; R = right hemisphere.

