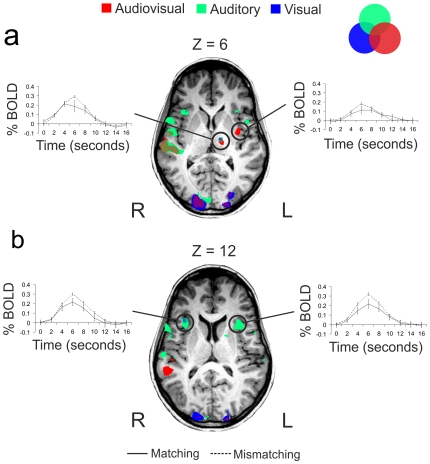
Figure 4. The axial slices show the left thalamus and bilateral insula activation at two z Talairach co-ordinates.
Activations were assessed by contrasting the brain response for the audiovisual >0 (red), auditory >0 (green), and visual >0 (blue) in Experiment 1. The event-related bold signals are shown for the regions of interest that responded with greater activation to emotionally mismatching than matching stimuli as presented during Experiment 2. The mismatching and matching conditions are represented as dashed and solid line respectively and are presented for the larger cluster of activation when the conditions from Experiment 1 overlap (i.e. when the same area activated for A and V, A and AV, V and AV, and A, V and AV). a) Left thalamus and left posterior insula; b) bilateral anterior insula. The error bars represent the standard error of the mean. L = left hemisphere; R = right hemisphere.

