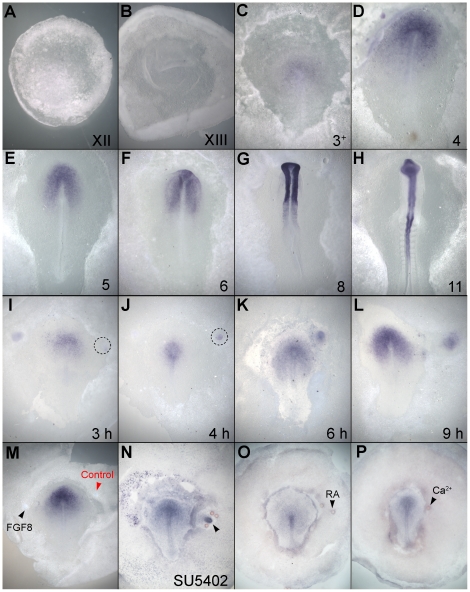
Figure 7. Expression and regulation of TrkC.
A–H. TrkC expression during early chick development. The stage of development is indicated on the lower right of each panel. Expression begins at mid-primitive streak stage (stage 3+; C) and intensifies in the neural plate thereafter (E–H). I–L. Time-course of induction of TrkC by a graft of Hensen's node. Induction begins about 4 hours after grafting (J) and becomes strong after about 6 hours (K, L). M. TrkC is not induced by FGF. Embryo shown 6 hours after implantation of a bead soaked in FGF8b (black arrow) and a control bead (red arrow). N. Induction of TrkC by the organizer does not require FGF signals. Embryo shown 6 hours after co-transplantantation of a Hensen's node and three beads soaked in SU5402. Induction of TrkC is not inhibited (arrow). O. TrkC is not induced by retinoic acid (arrow). P. TrkC is not induced by a bead soaked in ionomycin to increase intracellular Calcium (Ca2+; arrow).

