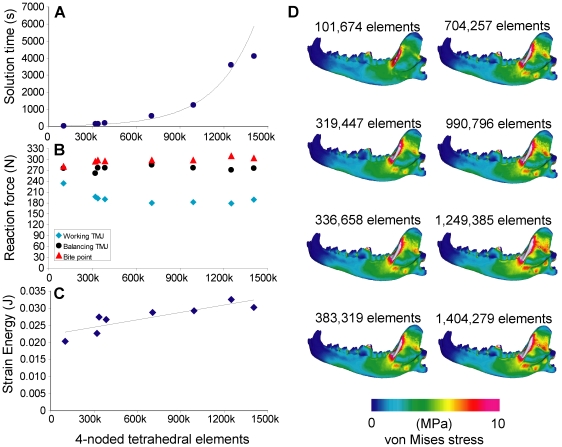
Figure 2. Sensitivity test on tetrahedral element quantity.
A. Element quantity plotted against solution time (in seconds), with exponential curve in background. B. Element quantity plotted against reaction force (in Newtons). C. Element quantity plotted against strain energy (in Joules), with linear regression line. D. von Mises stress distribution in the working-side dentary in test models; lateral view (in Megapascals).

