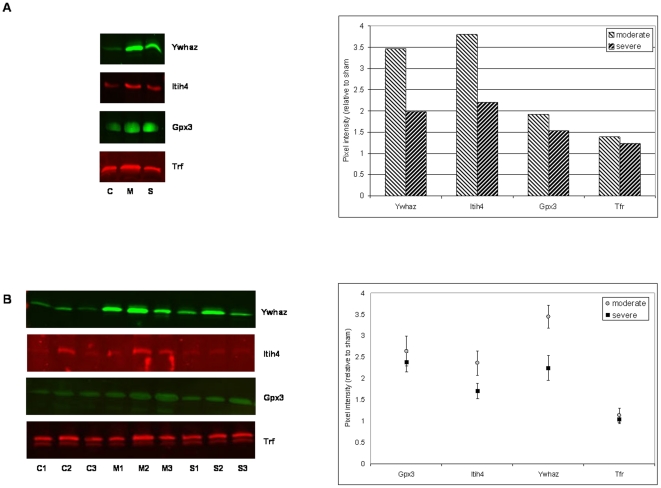
Figure 4. Western blot validation of candidate biomarkers of spinal cord injury.
(a) pooled sample of CSF from 12 sham injury rats (C); pooled sample of CSF from 12 moderate injury rats (M); pooled sample of CSF from 12 severely injured rats (S). The chart on the right shows quantification of the Western blots of moderately and severely injured rats relative to sham injury, (b) three pools of CSF from four sham, moderate and severe injury rats, C1–C3, M1–M3, S1–S3, respectively. The chart on the right shows quantification of the Western blots relative to sham injury. Each data point represents mean of three samples; error bars – standard error of the mean.

