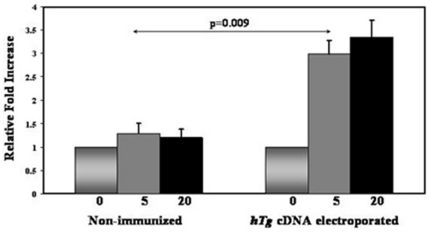
Figure 2. T cell stimulation.
Splenocytes isolated from immunized (2–3 months after the final boost) and non-immunized C3H/HeNmice were incubated with increasing concentrations of hTg protein for 72 hrs. Splenocytes from hTg immunized/electroporated mice showed significantly increased proliferation, compared to similarly challenged splenocytes from non-immunized mice. The x axis represents the concentration (µg/ml) of hTg which was used to stimulate the splenocytes. All T-cell proliferation experiments were performed in triplicates. Data, which were initially recorded as cpm, were subsequently expressed relative to splenocytes which did not receive thyroglobulin, are shown as mean + SEM.

