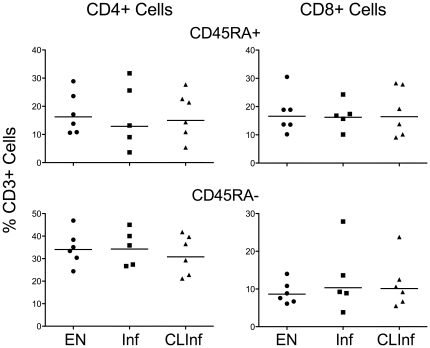
Figure 2. Total CD45RA+ and CD45RA− cells.
Data for CD45RA+ (top panels) and CD45RA− (bottom panels) cells are expressed as a percent of viable CD3+ cells in endemic normals (EN), filarial-infected patients (Inf), and in patients who had cleared their filarial infection (CLInf) for CD4+ cells (left panels) and CD8+ cells (right panels). Each point represents an individual patient and horizontal lines represent geometric means.

