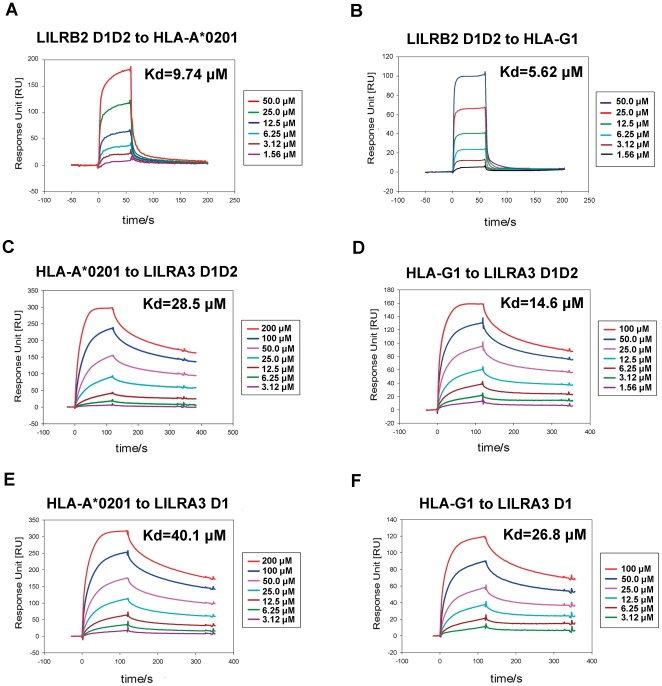
Figure 3. BIAcore® surface plasmon resonance analysis of LILRBA3 D1 and D1D2 monomer binding to immobilized HLA-A*0201 and HLA-G1.
A. Kinetic analysis of the LILRB2 D1D2 monomer binding to the immobilized HLA-A*0201 (as a positive control). Protein at the indicated concentrations was injected through the HLA-A*0201-immobillzed flow cells (700 response units (RU)). B. Kinetic analysis of the LILRB2 D1D2 monomer binding to the immobilized HLA-G1 (as a positive control). Protein at the indicated concentrations was injected through the HLA-G1-immobilized flow cells (300 RU). C. Kinetic analysis of the LILRA3 D1D2 monomer binding to immobilized HLA-A*0201. D. Kinetic analysis of the LILRA3 D1D2 monomer binding to immobilized HLA-G1. E. Kinetic analysis of the LILRA3 D1 monomer binding to immobilized HLA-A*0201. F. Kinetic analysis of the LILRA3 D1 monomer binding to immobilized HLA-G1.

