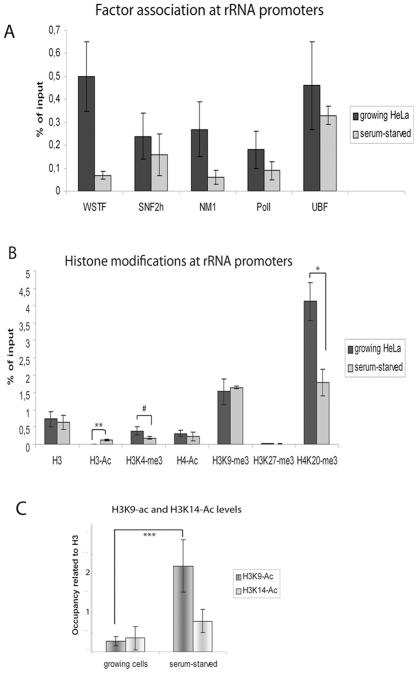
Figure 4. H3-Ac levels are reduced in growing HeLa cells.
(A) ChIP of growing cells and serum-starved cells with antibodies as indicated below, detected at the rRNA promoter. The values are presented as the percentages of the input signal for each primer pair. Error bars represent standard deviations from four separate experiments. (B) ChIP of growing HeLa cells and serum-starved cells at the rRNA promoters with antibodies indicated below the bars. The values are presented as the percentage of the input signal for each primer pair. Error bars represent standard deviations from six separate experiments. **: p-value = 0.0001, *: p-value = 0.01, #: p = 0.05 (Student t-test, two-sample equal variance). (C) ChIP of growing cells and of serum-starved cells using the antibodies indicated detecting the rRNA promoter. The signals have been adjusted to the signal from histone H3 in each experiment. Error bars represent standard deviations from four separate experiments. ***: p-value = 0.00036 (Student t-test, two-sample equal variance).

