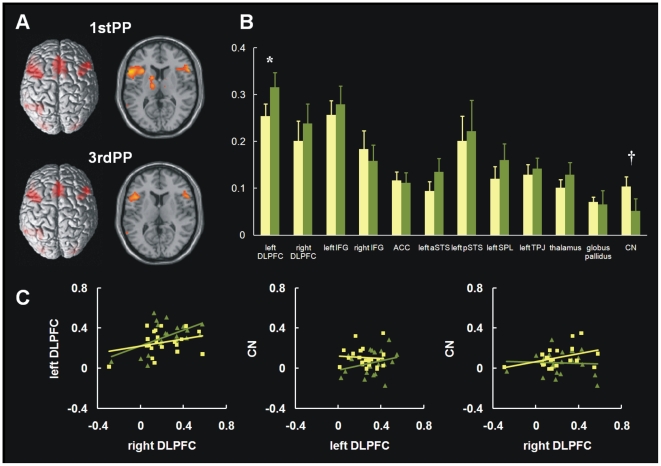
Figure 1. Activation areas for each condition superimposed on a 3D rendering of the brain and horizontal slice (right, z = 10).
The threshold for significant activation was p<0.001 uncorrected at the cluster level (Panel A). Mean signal changes for each condition are shown for each region of interest (ROI). The yellow (left) bar indicates the first-person-perspective (1stPP) condition, and the green (right) bar indicates the third-person-perspective (3rdPP) condition. Abbreviations: 1stPP = first-person perspective; 3rdPP = third-person perspective; DLPFC = dorsolateral prefrontal cortex; IFG = inferior frontal gyrus; ACC = anterior cingulate cortex; aSTS = anterior superior temporal sulcus; pSTS = posterior superior temporal sulcus; SPL = superior parietal lobule; TPJ = temporo-parietal junction; CN = caudate nucleus. *, p<.05; †, p<.10 (Panel B). Percent signal change correlations between the left and right DLPFC (left panel), CN and left DLPFC (front panel), and right DLPFC and CN (right panel). Square points indicate the 1stPP condition and triangle points indicate the 3rdPP condition (Panel C).

