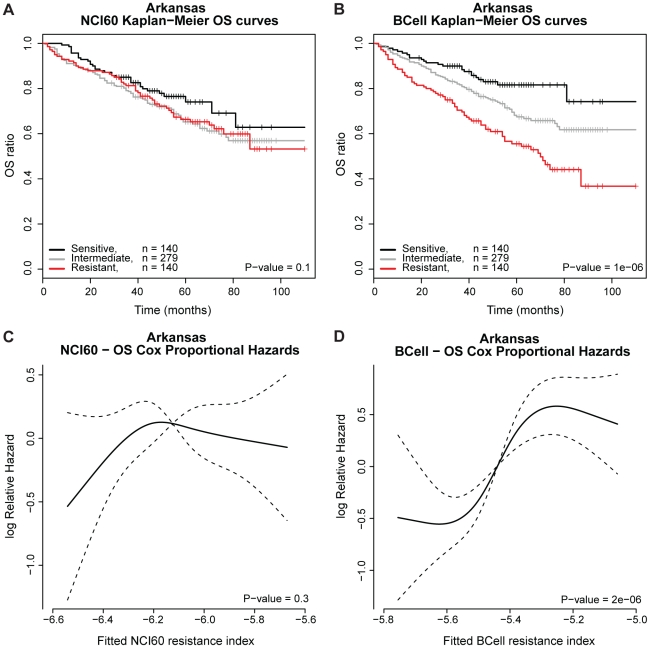
Figure 2. OS analysis for the Arkansas data.
A) Kaplan Meier survival curves based on NCI60. B) Kaplan Meier survival curves based on BCell. The samples are categorized into a 25% most sensitive risk group, an intermediate risk group of 50% and a 25% high risk group, based on the melphalan resistance index. The P-value is the logrank test for no difference in survival curves. C) Log relative hazard as function of the NCI60 resistance index. D) Log relative hazard as a function of the BCell resistance index. The P-value is the maximum likelihood test for no RCS-association between log relative hazard and resistance index and the dashed lines represent 95% confidence intervals.

