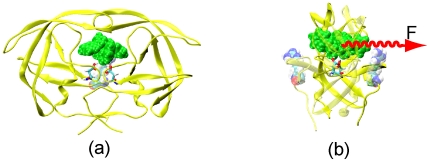
Figure 1. Carton draws of the HIV-1 protease in complex with inhibitor.
Residue Arg8 and Arg8′ were represented by VDW spheres. The inhibitor was represented by green VDW spheres. The red arrow shows the directions of the external forces implemented in the SMD simulations. (a) The front view of the bound complex; (b) The side view of the bound complex with an external force applied on the inhibitor.

