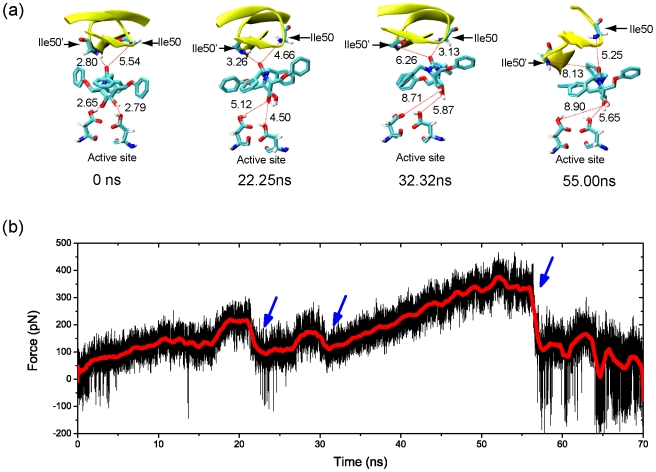
Figure 3. Dissociation process of AHA001 from the protease.
(a) Snapshots of AHA001 escaping from the binding pocket of the protease under the external pulling force. The numbers in the panel indicate the lengths of the H-bonds, and the simulation times are given at the bottom of each snapshot. (b) The pulling force of the AHA001 bound complex during the SMD simulation. The red curve is the average values with a running average time window of 500 ps. The blue arrows indicate the critical points of force dropping during the simulation.

