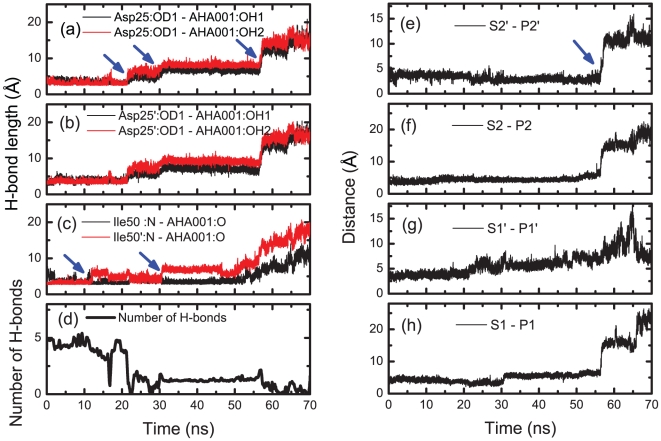
Figure 4. Analyses of the dynamics of H-bond interaction and hydrophobic interactions in AHA001 bound complex.
(a) to (c): The H-bond lengths between the protease and the inhibitor AHA001 during the SMD simulation. (d) Evolution of the number of H-bonds between the protease and the inhibitor AHA001 during the simulation. (e) to (h): The distances between the subsites (S) of protease and the sidechains (P) of inhibitor AHA001 during the simulation, which were used to monitor the state of the hydrophobic clusters. The blue arrows indicate the critical points of bond length change during the simulation.

