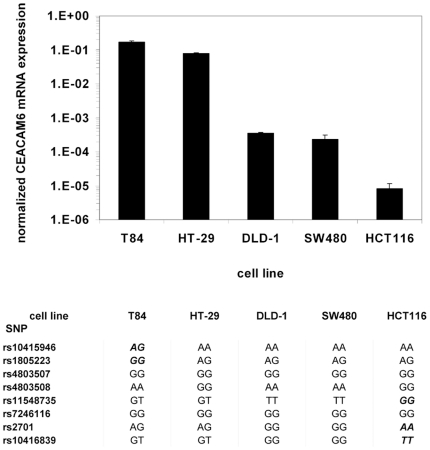
Figure 2. Analysis of CEACAM6 gene expression and CEACAM6 gene variants in intestinal epithelial cell (IEC) lines.
(A) Total RNA isolated from IEC lines as indicated was reverse transcribed and was analyzed for CEACAM6 gene expression by quantitative PCR. T84 cells express CEACAM6 at the highest level followed by HT-29 cells, and intermediate CEACAM6 expression was found in SW480 and DLD-1 cells. CEACAM6 expression was close to the detection limit after 40 PCR cycles in HCT116 cells (note the logarithmic scale on the y-axis). CEACAM6 expression was normalized to β-actin expression in the respective cDNA samples. (B) Genomic DNA was isolated from IEC lines and 8 SNPs in CEACAM6 were analyzed as indicated by DNA sequencing. The respective alleles for these SNPs in each cell line are depicted in the table. This analysis revealed that T84, the cell line with the highest CEACAM6 expression, and HCT116 cells, the cell line with the lowest CEACAM6 expression, are the only IEC lines with unique genotypes for certain CEACAM6 SNPs (depicted in bold italic). DLD-1 and SW480 cells have identical genotypes for all SNPs analyzed and nearly identical CEACAM6 expression levels.

