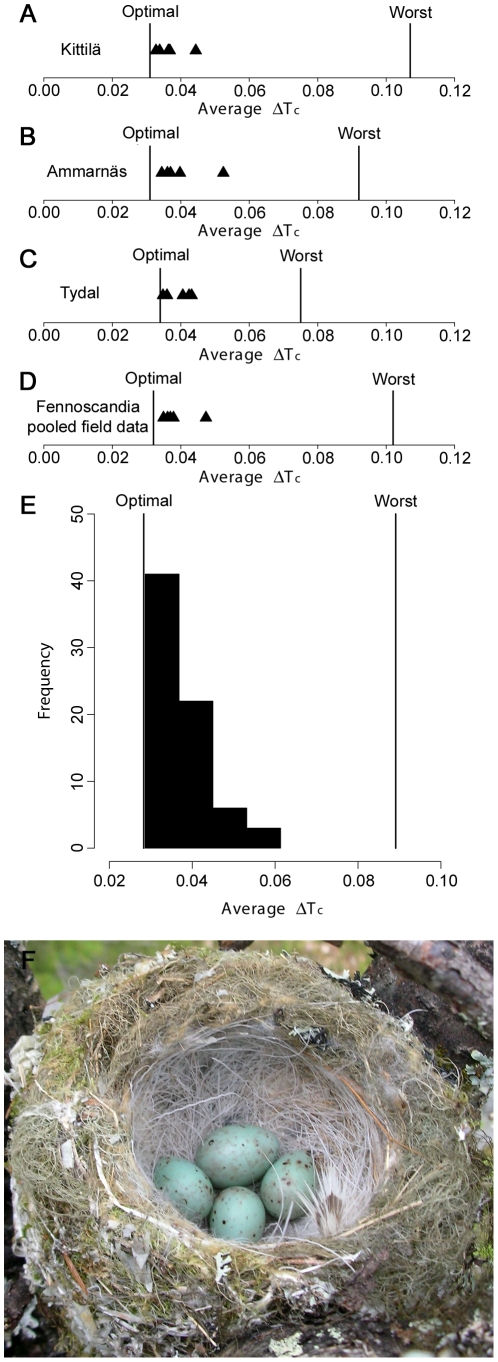
Figure 3. Colors of cuckoo eggs in relation to predicted optimum for parasitism of bramblings.
Black triangles (A–D) and black bars (E) indicate the mean color contrast of cuckoo eggs resulting from comparison with all brambling clutches in a population. The leftmost vertical line in each figure indicates the lowest average color contrast that can be achieved, given the color distribution of the host's clutches. The rightmost vertical line in each figure indicates the highest average color contrast a cuckoo egg could have, and still be a perfect match to at least one of the host clutches in the population. Cuckoo eggs in A–D were all found in Kittilä (N = 5), whereas cuckoo eggs in e were measured in museums (N = 72). A: Kittilä (N = 88 host clutches). B: Ammarnäs (N = 97 host clutches). C: Tydal (N = 47 host clutches). D: Kittilä, Ammarnäs and Tydal pooled (N = 232 host clutches). E: museum clutches collected in the period 1841–1979 (N = 343 host clutches). F: a brambling clutch with three host eggs and one cuckoo egg (top).

