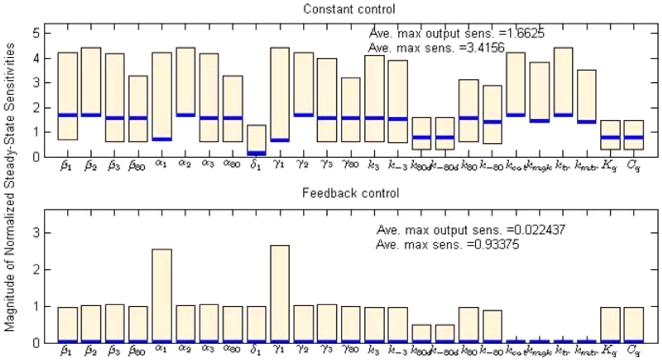
Figure 9. Comparison of normalized steady-state sensitivities (NSSS) between constant and feedback control.
The NSSS of the feedback control case has significantly smaller magnitude in terms of average maximal sensitivities for all states (0.93 v.s. 3.42) and the output state (0.02 v.s. 1.66). The bars describe the maximum and minimum values of NSSS of the states with respect to each parameter. The solid lines denote the output NSSS on each parameter.

