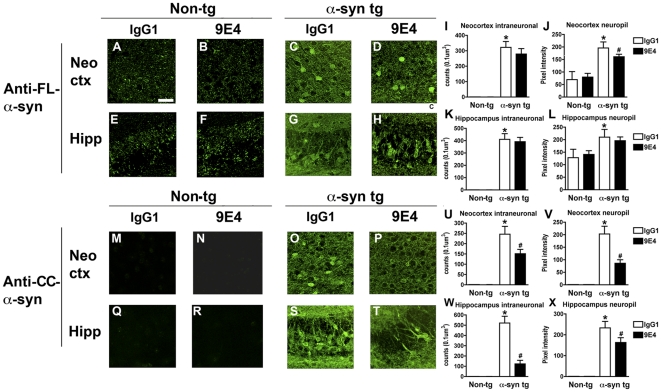
Figure 4. Comparative immunohistochemical analysis with antibodies against full length or calpain-cleaved a-syn in passively immunized a-syn tg mice.
To examine the effects of immunization on α-syn accumulation, immunohistochemical analysis using antibodies against FL-α-syn (layers 5–6) and CC-α-syn was conducted. Panels illustrate laser scanning confocal images of the temporal cortex and hippocampus (CA3) immunolabeled with antibodies against FL and CC α-syn immunoreactivity. (A, C) Temporal cortex of IgG1-immunized non-tg and α-syn tg mouse immunolabeled with an antibody against FL-α-syn, respectively. (B, D) Temporal cortex of 9E4-immunized non-tg and α-syn tg mouse immunolabeled with an antibody against FL-α-syn, respectively. (E, G) Hippocampus of IgG1-immunized non-tg and α-syn tg mouse immunolabeled with an antibody against FL-α-syn, respectively. (F, H) Hippocampus of 9E4-immunized non-tg and α-syn tg mouse immunolabeled with an antibody against FL-α-syn, respectively. (I) Image analysis of the numbers of neocortical α-syn immunoreactivity neurons with the FL α-syn antibody. (J) Analysis of the levels of α-syn immunoreactivity in the neuropil in the neocortex in sections labeled with the FL α-syn antibody. (K) Image analysis of the numbers of hippocampal α-syn immunoreactivity neurons with the FL α-syn antibody. (L) Analysis of the levels of α-syn immunoreactivity in the neuropil in the hippocampus in sections labeled with the FL α-syn antibody. (M, O) Temporal cortex of IgG1-immunized non-tg and α-syn tg mouse immunolabeled with an antibody against CC α-syn, respectively. (N, P) Temporal cortex of 9E4-immunized non-tg and α-syn tg mouse immunolabeled with an antibody against CC α-syn, respectively. (Q, S) Hippocampus of IgG1-immunized non-tg and α-syn tg mouse immunolabeled with an antibody against CC α-syn, respectively. (R, T) Hippocampus of 9E4-immunized non-tg and α-syn tg mouse immunolabeled with an antibody against CC α-syn, respectively. (U) Image analysis of the numbers of neocortical α-syn immunoreactivity neurons with the CC α-syn antibody. (V) Analysis of the levels of α-syn immunoreactivity in the neuropil in the neocortex in sections labeled with the CC α-syn antibody. (W) Image analysis of the numbers of hippocampal α-syn immunoreactivity neurons with the CC α-syn antibody. (X) Analysis of the levels of α-syn immunoreactivity in the neuropil in the hippocampus in sections labeled with the CC α-syn antibody. Scale bar = 30 µM. N = 20 mice per group; 12 month old. Error bars represent mean ± SEM. (*) indicates p<0.05, when comparing IgG1-immunized α-syn tg mice to IgG1-imunized non-tg mice by one-way ANOVA with post hoc Dunnett's. (#) Indicates p<0.05, when comparing α-syn tg mice immunized the 9E4 α-syn antibody to IgG1-treated α-syn tg mice by one-way ANOVA with post hoc Dunnett's.

