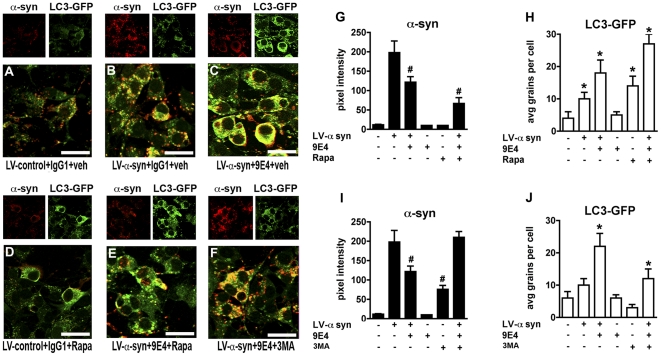
Figure 10. The effects of the 9E4 monoclonal antibody on promotion of α-syn clearance via autophagy in a neuronal cell model.
(A) Baseline co-localization of α-syn and LC3-GFP in neuronal cells infected with LV-control and treated with the IgG1 control antibody. (B) Baseline co-localization of α-syn and LC3-GFP in neuronal cells infected with LV-α-syn and treated with the IgG1 control antibody. (C) Co-localization of α-syn and LC3-GFP in neuronal cells infected with LV-α-syn and treated with the 9E4 antibody. (D) Co-localization of α-syn and LC3-GFP in neuronal cells infected with LV-control, treated with the IgG1 control antibody and rapamycin, an inducer of autophagy. (E) Co-localization of α-syn and LC3-GFP in neuronal cells infected with LV-α-syn, treated with the 9E4 antibody and rapamycin, an inducer of autophagy. (F) Co-localization of α-syn and LC3-GFP in neuronal cells infected with LV-α-syn, treated with the 9E4 antibody and 3MA, an inhibitor of autophagy. (G) Analysis of α-syn immunoreactivity in neuronal cells infected with LV-α-syn, treated with the 9E4 antibody and rapamycin. (H) Analysis of LC3-GFP signal in neuronal cells infected with LV-α-syn, treated with the 9E4 antibody and rapamycin. (I) Analysis of α-syn immunoreactivity in neuronal cells infected with LV-α-syn, treated with the 9E4 antibody and 3MA. (J) Quantitative analysis of LC3-GFP signal in neuronal cells infected with LV-α-syn, treated with the 9E4 antibody and 3MA. Scale bar (A–F) = 10 µM (*) Indicates p<0.05 compared to LV-control infected and vehicle-treated cultures by one-way ANOVA with post-hoc Dunnett's test. (#) Indicates p<0.05 compared to LV-control infected and vehicle-treated cultures by one-way ANOVA with post-hoc Tukey-Kramer test. Error bars represent mean ± SEM.

