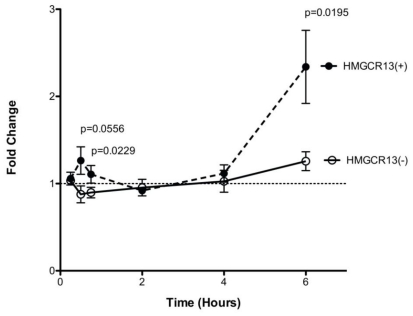
Figure 5. Transcriptional versus splicing regulation in HepG2 cells.
Time course analysis of HMGCR gene expression in HepG2 cells incubated with 2.0 uM simvastatin +10% LPDS, or placebo + 10% FBS, n = 5. Change in HMGCR alternative splicing occurs within 30 min minutes post-treatment as indicated by an immediate down-regulation of HMGCR13(−), open circles, and corresponding up-regulation of HMGCR13(+), solid circles. Data were calculated as the ratios of the fold changes of the statin versus placebo treated sample at each individual time point in comparison to 0 minutes. Values plotted are mean ± s.e.m.

