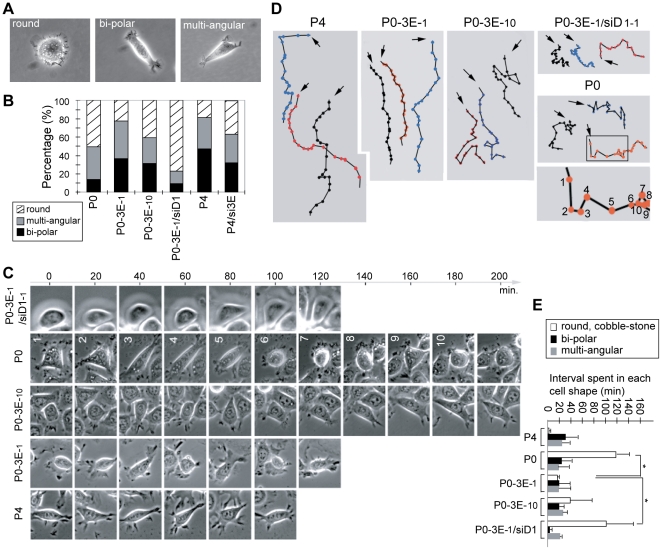
Figure 4. Sema3E/Plexin-D1 activity alters the cytomorphology of ovarian endometrioid cancer cells.
A. Representative images of three distinct cell shapes of OEC cells as round, bi-polar and multi-angular. B. Quantification of the percentage of each morphology in an overall population (n≥400) of OEC clones with variable activity of Sema3E/Plexin-D1. C, D, E. Time-lapse tracing (up to 200 minutes with 20-min tracing intervals) of the morphological dynamics of single OEC cells in a wound-healing process (C). Single OEC migratory paths were plotted (D). Arrows indicate the start of each tracing, and colored dots indicate the position of the traced cell at each time point. Each step in the migratory sequence was labeled with the numbers same as those in (C). The bar graph in (E) summarized average time-interval spent by each OEC cell on each distinct cell shape. *, P<0.05, paired t-test.

