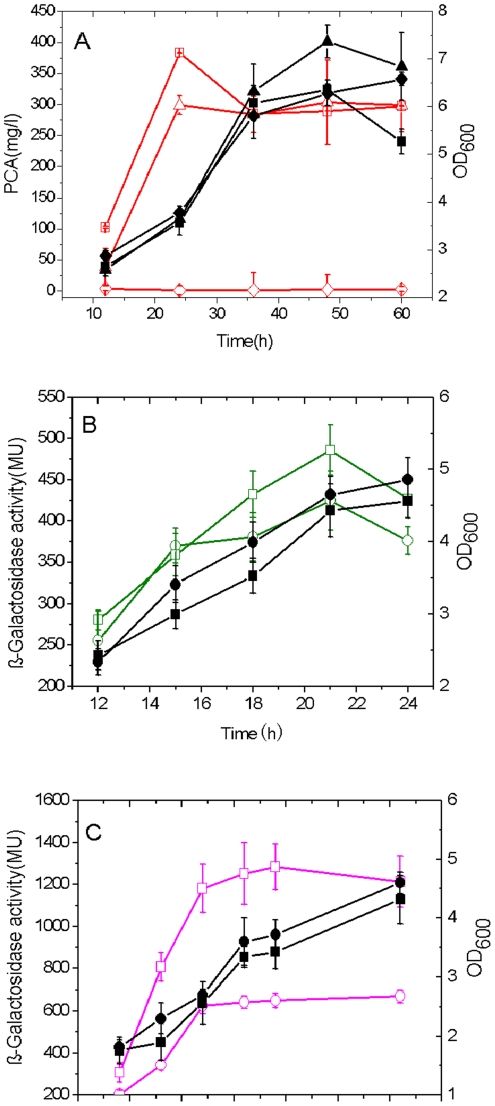
Figure 5. The PCA production was negatively regulated by GacA via phzA2-G2 cluster mainly at post-transcriptional level.
PCA production and cell growth curves in single gacA inactivated mutant M18ΔG (square), double gacA and phzA1-G1 mutant M18ΔGΔP1 (triangle) or double gacA and phzA2-G2 mutant M18ΔGΔP2 (diamond) (A). The cell growth and expression of transcriptional fusion pMP2C (B) or translational fusion pMP2L (C) in wild type strain M18 (circle) and mutant M18ΔG (square). Symbols: solid, growth curves; empty, PCA production or β-Galactosidase activities. All experiments were performed in triplicate, and each value is presented as the average ± standard deviation.

