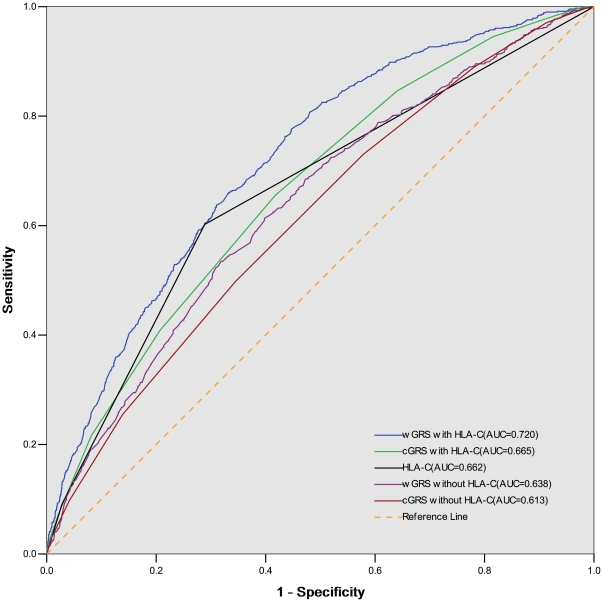
Figure 3. Receiver-operating characteristic curves for models predicting diagnosis psoriasis.
The AUC for wGRS is significantly greater than AUC for cGRS, p = 2.13×10⁻⁸. The AUC for HLA-C alone (rs10484554) is not statistically different than the AUC for cGRS, and no worse than the AUC for the wGRS with HLA-C excluded, p = 0.18. AUC: area under curve. wGRS: weighted genetic risk score. cGRS: counted genetic risk score.

