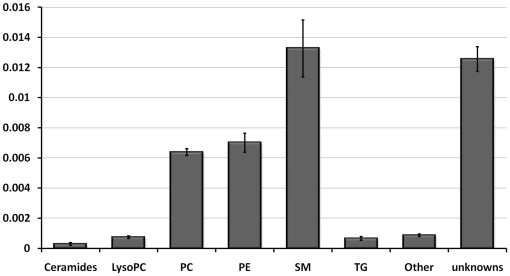
Figure 1. The relative abundance of lipid classes in porcine lens crude lipid extracts based on UPLC-QTOF MS analysis.
Each bar represents the mean concentration of six lens extracts. Error bars are standard deviations of six individual measurements. The y-axis is given as nmoles/mg of lens protein. LysoPC, lyso-phosphatidylcholine; PC, phosphatidylcholine; PE, phosphatidylethanolamine; SM, Sphingomyelin; TG, triglyceride.

