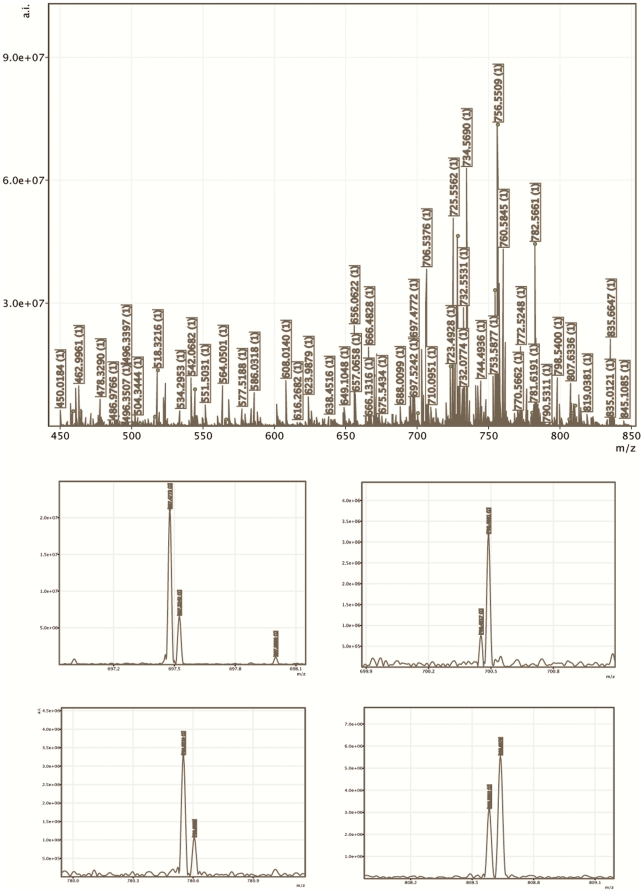
Figure 3. Fourier transform ion cyclotron resonance mass spectrometry (FTICR MS) mass spectra displayed in the mass range of identified lipids (top) and four selected zoomed spectra (bottom).
In the top spectra, circle on a crest of mass peaks indicates sodium adducts of the identified glyceroposholipids. At the bottom, we demonstrate using nominal m/z 697, 700, 780, and 808 the importance of the use of high-resolution MS in imaging. Analyte peaks are separated from interfering biological and MALDI matrix peaks.

