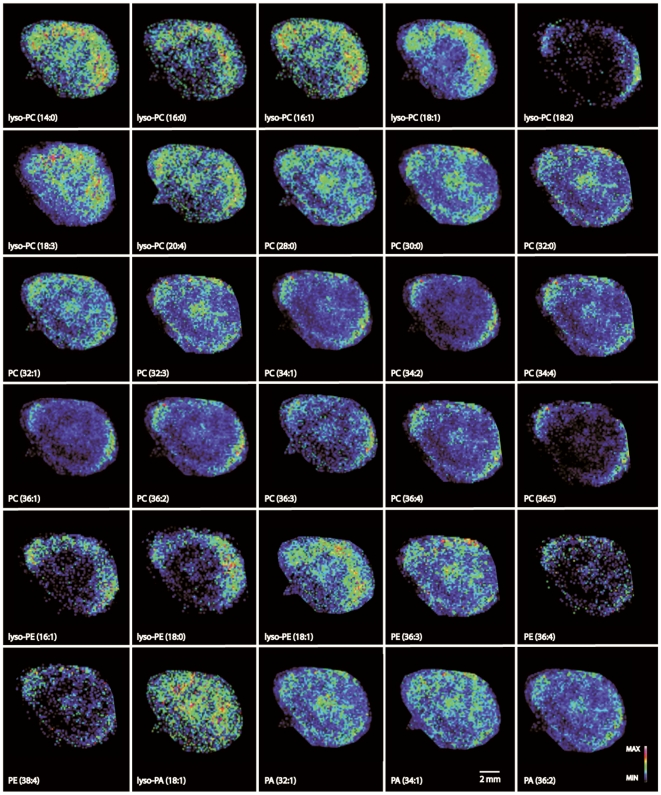
Figure 5. Spatial distribution of glycerophosphocholines (PCs), glycerophosphatidylethanolamine (PE) and glycerophosphates (PAs) visualized in false colors.
MALDI-MS images were acquired by an APEX Ultra 9.4 T FT-ICR mass spectrometer equipped with a Smart beam laser. The molecular images of the lipids were visualized using the FlexImaging software, and the intensity of the image was normalized to the total ion chromatogram. Identification of lipids was performed from the average spectra of the entire lens using Mass data analysis software.

