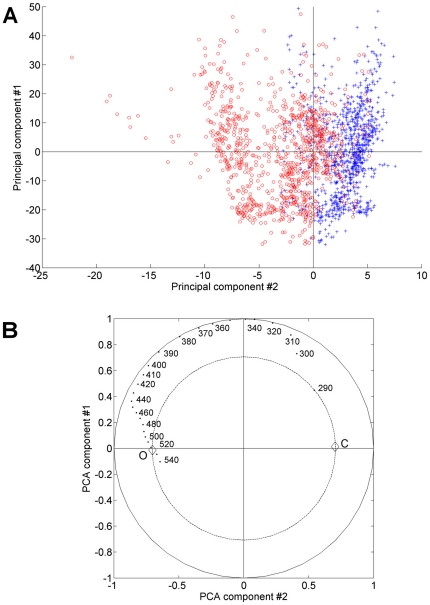
Figure 2. Principal component analysis of control and ofloxacin-treated vegetation spectra.
Score plot of first (PC1) and second (PC2) principal components (A). Control (blue +) and ofloxacin-treated (red o) spectra were respectively associated with positive and negative PC2 scores. Correlation loading plot of PC1 and PC2 (B). Correlation of wavelengths with PC1 and PC2 scores are shown for wavelengths ranging from 290 to 540 nm. The outer ellipse and inner ellipse indicate 100% and 50% explained variance respectively. C = control; O = ofloxacin.

