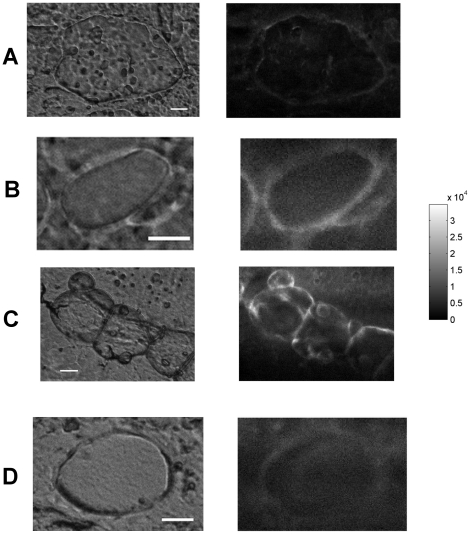
Figure 5. Fluorescence of control (A) and ofloxacin-treated (B,C,D) vegetation in the 510–560 nm range.
Transmission (left) and fluorescence (right) images. The bacterial masses imaged on maps B, C and D located respectively in the intermediate, peripheral and central areas of the tissue specimen. The grayscale was the same for all maps. Fluorescence intensity values (median [range]) for A, B, C and D maps were respectively 2624 [0–14560], 8160 [1168–23376], 6736 [0–34928], and 6128 [432, 14640]. Each ofloxacin map intensity was significantly different from the control map (Mann-Whitney test, p<0.0001 for all). White bar = 10 µm.

