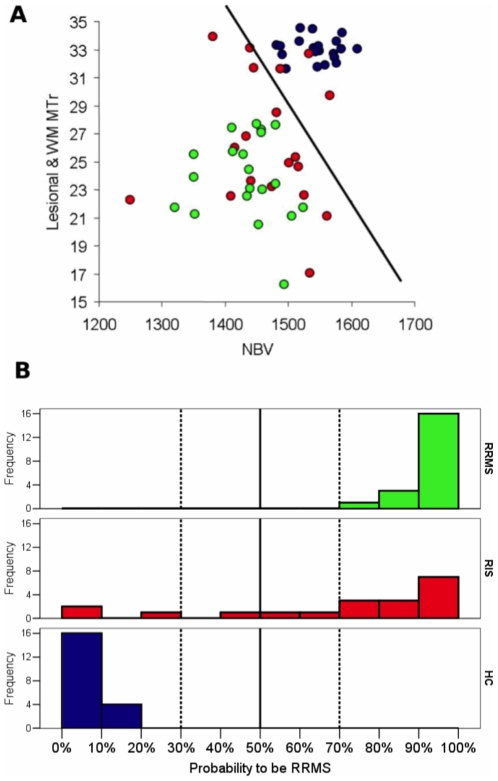
Figure 5. Logistic regression analysis: probability for RIS to be HC or RRMS.
Panel A shows the distribution of subjects according to their NBV and lesional-WM MTr. HC are in blu, RIS subjects in red, and RRMS patients in green. Lesional-MTr values were calculated in RIS subjects and RRMS patients from T2-W lesional WM regions. MTr values in the WM of HC were calculated from areas homologous to those of the WM lesions of the RIS and RRMS. The black line separates the subjects with a probability of being a RRMS patient below and above 50%, according to the coefficients estimated by the penalized logistic model. The histogram of probability to be RRMS, as estimated according to the penalized logistic model including NBV and lesional-MTr as independent predictors, is reported in panel B. See text for further details.

