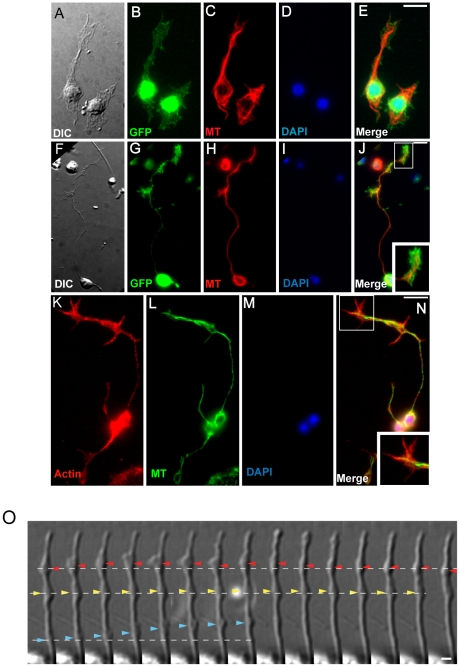
Figure 4. Cultured larval neurons extend projections and growth cones in vitro.
(A–E) Microtubule network and cytoplasmic projections in GFP expressing cells isolated at L1 stage from an unc-119::GFP neuronal maker line. (A) DIC image of unc-119::GFP positive cells, (B) GFP expression in cell bodies (green), (C) anti-tubulin staining showing microtubules (red), (D) DAPI staining showing nuclei (blue), and (E) merged fluorescent images of fixed cells. (F–J) Microtubule network and cellular extensions in GFP expressing neurons after two days in culture. Staining as in A–E. (J) Enlarged inset shows a growth cone. (K–N) Actin and microtubule networks in neurons isolated from L1 stage N2/wildtype nematodes and fixed after 1 day. (K) Rhodamine-phalloidin staining for actin (red), (L) anti-tubulin staining for microtubules (green), (M) DAPI staining (blue), and (N) merged images. Enlarged inset in (N) shows actin enrichment in growth cone. Scale bars: 5 µm. (O) DIC time-lapse series of cellular activities in the dendrite-like extension process of a neuron isolated from L4 stage worms. Dotted lines represent baseline positions of each of three intracellular motilities. Red arrowheads: appearance and disappearance of a large protrusion. Yellow arrowheads: a relative static protrusion. Blue arrowheads: rapid forward movement of a protrusion. Interval between each frame is 5 sec. Scale bar: 1 µm.

