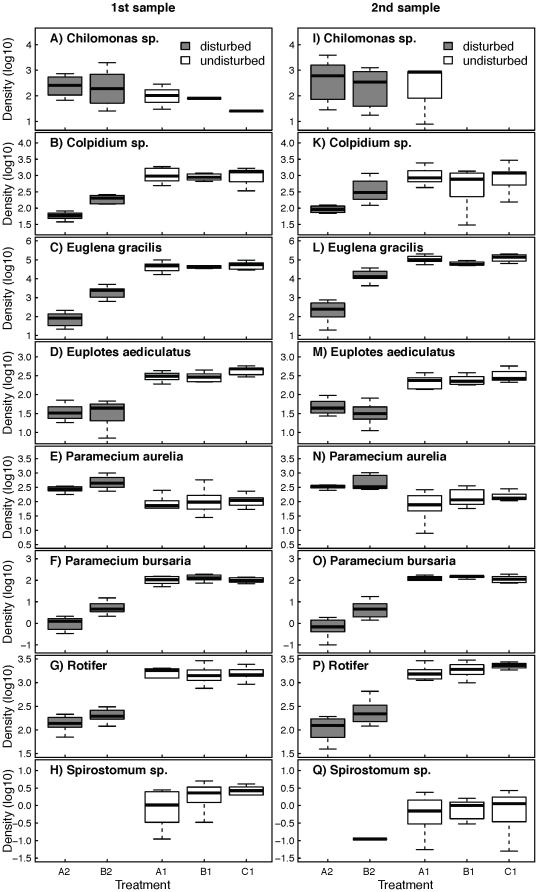
Figure 5. Population densities of all protozoa and rotifer species.
Density (log10) of all eight species within single communities in undisturbed and disturbed patches (white and grey boxplots respectively) after 32 days (first sampling; A–H) and at the end of the experiment after 43 days (I–Q). A1 and A2 were isolated patches, while B1, B2 and C1 were connected patches (see also Fig. 1). Boxplots give median (bold line), first and third quartile (box). Whiskers give either the range of the data or 1.5 times the interquartile range, whichever is smaller.

