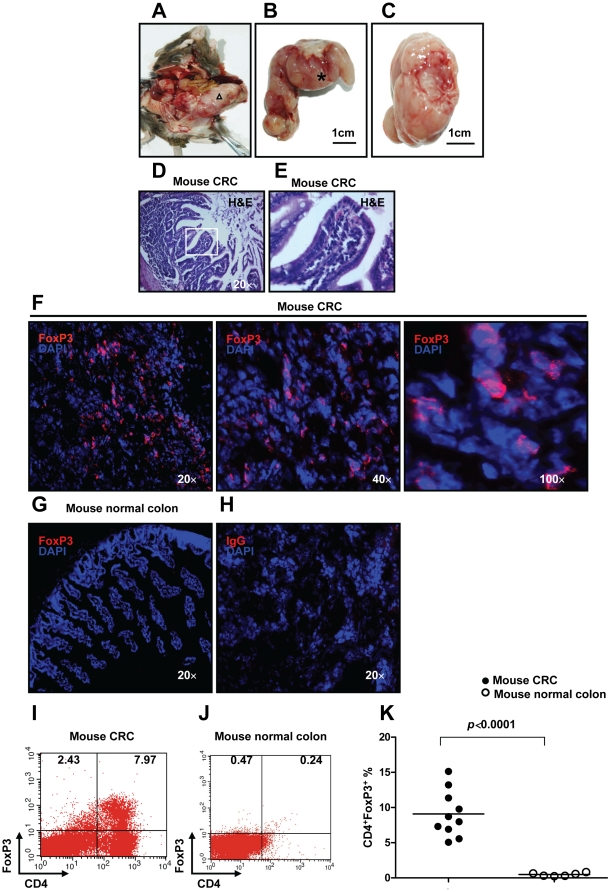
Figure 1. Increased numbers of FoxP3+ Treg-cells in tumor-infiltrating lymphocytes of CRC induced by MNU and H. pylori. in mice.
(A) Eighty weeks old C57BL/6J mouse with large CRC induced by MNU and H. pylori. (B) Higher magnification of the area indicated by the triangle (Δ) of (A). (C) Transect of the area indicated by the asterisk (*) of (B). (D) H&E staining of colorectal carcinoma tissue derived from CRC induced by MNU and H. pylori (original magnification, ×20). (E) Higher magnification of (D) as indicated by the rectangle. To examine FoxP3+ Treg-cells in mice with CRC induced by MNU and H. pylori, immunofluorescence staining of FoxP3 was performed on cryosections from mouse CRC or normal colon tissue. (F) Expression of FoxP3 (Red staining) in mouse CRC (original magnification, ×20, ×40 and ×100). (G) Negative expression of FoxP3 in mouse colon tissue (original magnification, ×20). (H) Rat IgG control staining (original magnification, ×20). Lymphocytes infiltrating CRC (n = 10) and normal mucosa (n = 6) were isolated for Flow cytometric analysis of FoxP3 expression. (I, J) The frequency of Treg-cells in CRC derived from eighty weeks old C57BL/6J mouse and normal mucosa in mice. (K) A significant increase in the frequency of Treg-cells was found in TIL of CRC compared with normal mucosa (p<0.0001 by Student's t Test). Representative data are shown which had been reproduced in 3 independent experiments.

