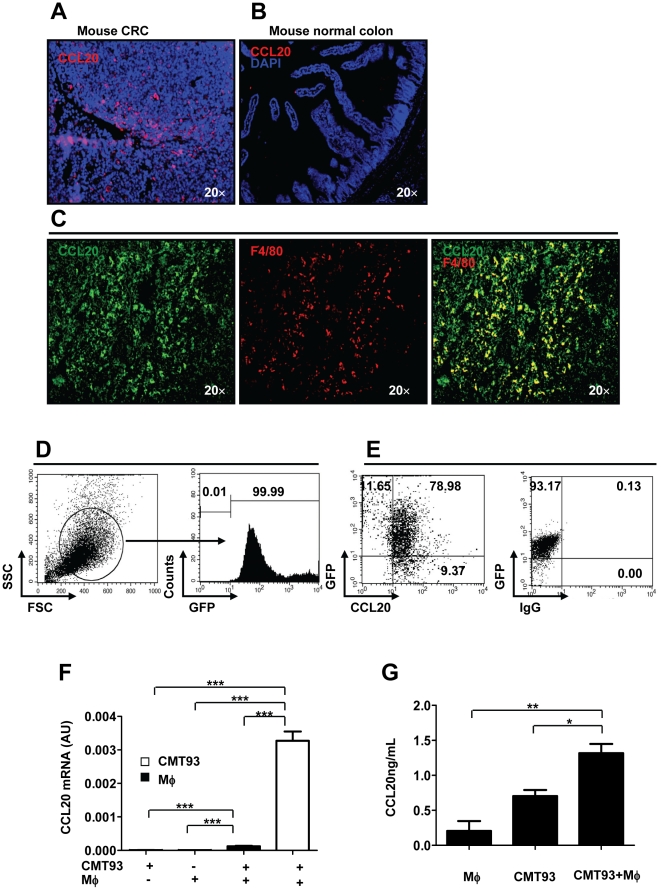
Figure 3. Contribution of TAMs to CCL20 production in CRC in mice.
(A, B) Cryosections from mouse CRC induced by MNU and H. pylori or mouse normal colon were stained for CCL20 (red, original magni-fication, ×20). Double immunostaining with anti-mouse CCL20 and F4/80 mAb was performed on cryosections derived from mouse CRC. (C) Co-localization of CCL20 with F4/80 staining (original magnification, ×20). (D) CMT93 was transducted with GFP, and confirmed by flow cytometry. (E) Flow cytometric analysis of CCL20+ cells three weeks after GFP+ CMT93 cells grafting in C57BL/6J mice. (F) mRNA levels of CCL20 for co-culture of mouse peritoneal macrophages with CMT93 cancer cells. AU, arbitrary units. (G) Protein levels of CCL20 for co-culture of mouse peritoneal macrophages with CMT93 cancer cells. Representative data are shown which had been reproduced in at least 2 independent experiments. * p<0.05, ** p<0.01,*** p<0.001, Student's t test.

