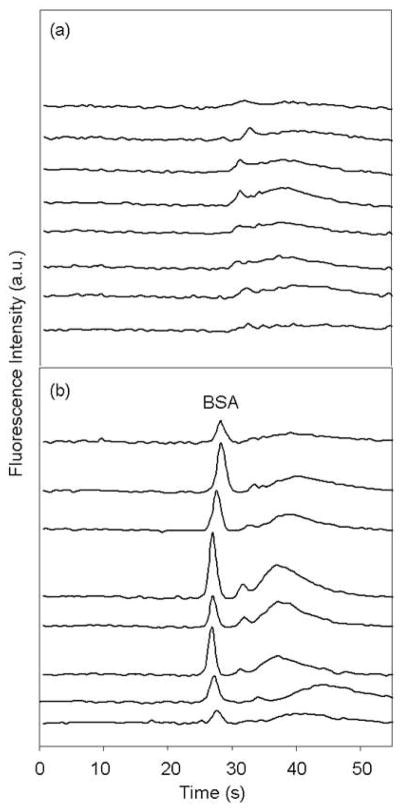
Figure 4.
Microchip electropherograms in 8 lanes after injection of (a) CE dye 503 only and (b) 20 μg/mL BSA labeled on-chip with CE dye 503. Electropherograms are offset vertically for clarity. The broad system peak (30–50 s) is from dye-CTAB complexes in the running buffer as reported previously.12

