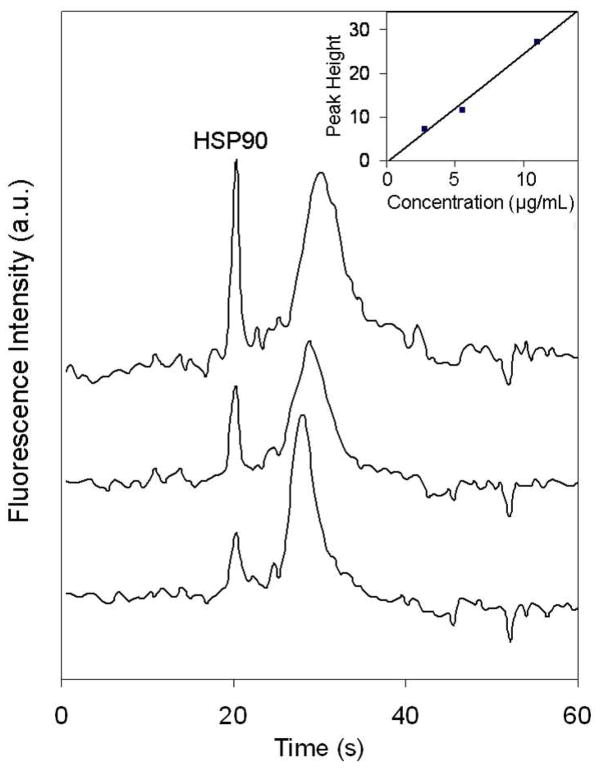
Figure 5.
Microchip electropherograms of different concentrations of HSP90 labeled on-chip with CE dye 503 in three adjacent lanes. Offset traces from bottom to top are 2.75, 5.50, and 11.0 μg/mL HSP90. The gated injection time was 1.0 s. (inset) Plot of HSP90 concentration vs. peak height. The detection limit (3σ) was calculated to be 600 ng/mL. The slope is 2.48 with a standard deviation of 0.40, while the intercept is −0.6 with a standard deviation of 1.6. The broad system peak at ~30 s is explained in the Figure 4 legend.

