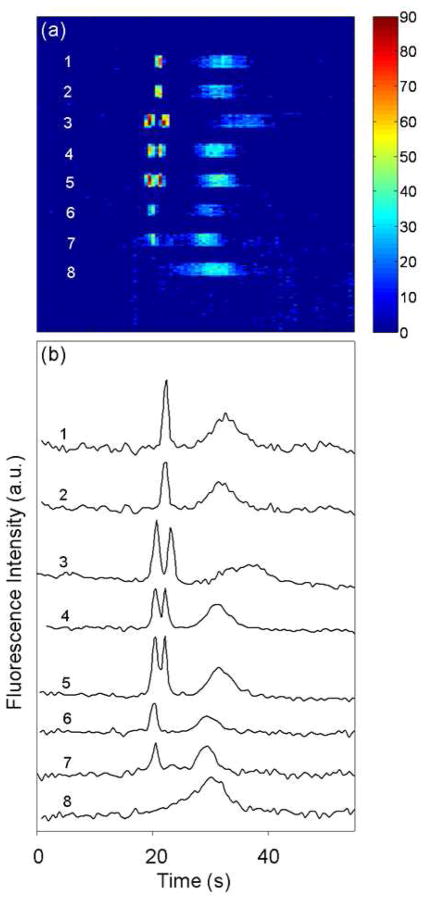
Figure 6.
Separation of protein samples labeled on-chip in an 8-lane microdevice. (a) Time sequence image of CCD data from the detection zone. Protein peaks appear at ~20 s. Lanes 1–2 are 25 μg/mL CytC, lanes 3–5 are a mixture of 25 μg/mL CytC and 11 μg/mL HSP90, lanes 6–7 are 11 μg/mL HSP90, and lane 8 is a blank with only the fluorescent label. (b) Vertically offset electropherograms extracted from the CCD data in (a). The broad system peak at 30–40 s is explained in the Figure 4 legend.

