Figure 3.
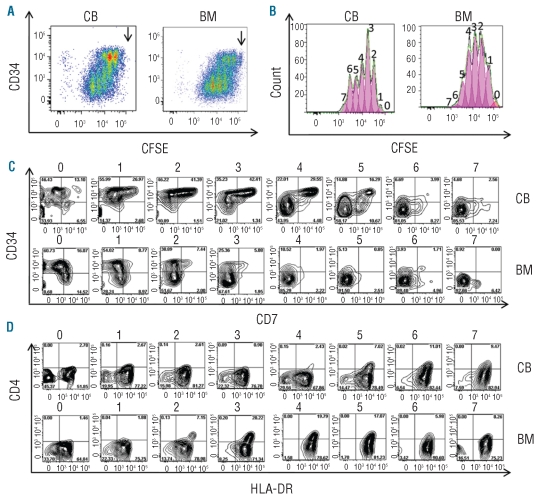
Comparative CFSE profiles and cell surface phenotype of HSC co-cultured on OP9-DL1 for 4 days reveals higher propensity of cord blood (CB) than bone marrow (BM) HSC to generate T lymphocytes. CFSEhighCD34highLin− precursors were purified by FACS (>99.5% pure, n = 3) from CB or BM mononuclear cells loaded with CFSE; labeled with CD34−, Lin-specific antibodies; and co-cultured on OP9-DL1 stroma for 4 days (D4). The CFSEhighCD34highLin− progeny was stained with CD34, CD7, CD5, CD4 and HLA-DR-specific antibodies and submitted to flow cytometry analysis to quantify CFSE content (numbers on top of each peak designate the number of progeny divisions, with 0 representing no division) (A) and surface CD34 levels in each generation dot-plot analysis of CD34 expression versus CFSE content (B), using the same samples as in (A) [position of undivided cells is shown (↓)]. (C) Day 4 expression of CD34 and CD7 in gated CD34+ cells ordered by their progeny generation, as defined by CFSE levels and indicated by numbers on top of the plot. Numbers in quadrants represent the frequency of positive cells. (D) Day 4 expression of CD4 and HLA-DR in gated CD34+ cells ordered by their progeny generation, as defined by CFSE levels and indicated by numbers on top of the plot. Numbers in quadrants represent the frequency of positive cells. Data are representative of the results from three independent experiments. Note that in OP9-DL1 co-cultures, in the first wave of development, CD34highLin− precursors asymmetrically self-renew and differentiate into two distinct populations that down-regulate CD34, up-regulate HLA-DR and acquire CD4 on the one hand and maintain CD34, down-regulate HLA-DR but acquire CD5 and CD7 on the other hand.

