Figure 1.

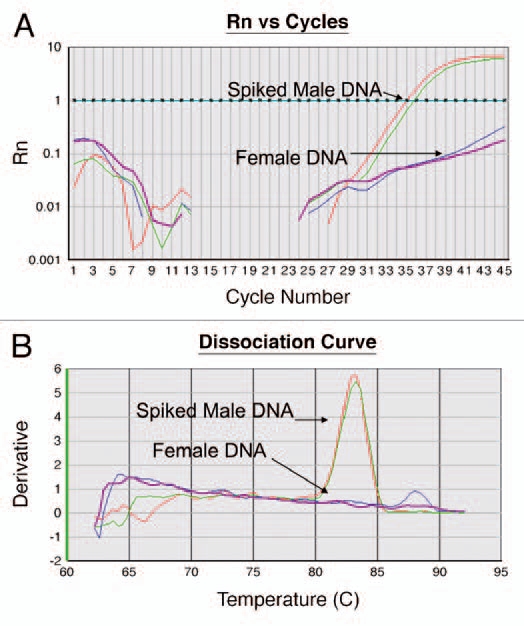
(A) Amplification Curve. The assay is performed in a 96 well plate where each well is monitored at every cycle for fluorescent intensity (Rn, y-axis). As PCR progresses and generation of new amplicons, Rn increases until reaching a plateau. At the end of each run, a user-defined threshold is set. This threshold is the level of fluorescence at which CTs or threshold cycle, is calculated. This threshold is set higher than the noise level in the baseline. During the reaction, the cycle number at which the fluorescent intensity crosses the threshold value is defined as CT. The CT represents the cycle at which a statistically significant increase in ΔRn is first detected. Therefore, samples with a low CT have an abundant target. In this figure, the threshold is set to 1 and the CT of the female DNA spiked with positive DNA is at an average of 35.5. The DNA from a female subject (negative) does not cross the threshold. (B) Dissociation Curve. At the end of the cycle, the generated amplicons were analyzed for specificity. The amplified products were melted by increasing the temperature to 95°C with melt temperature corresponding to the temperature at which half of the amplicons are denatured. The derivative (y-axis) is the slope of the curve generated by the melting curve. The peak of the dissociation curve is equal to the melting temperature. Temperature is labeled on x-axis (60°C to 95°C). In this figure the spiked positive DNA melts at 83°C. The DNA from a female subject (negative) predictably failed to generate any amplified product.
