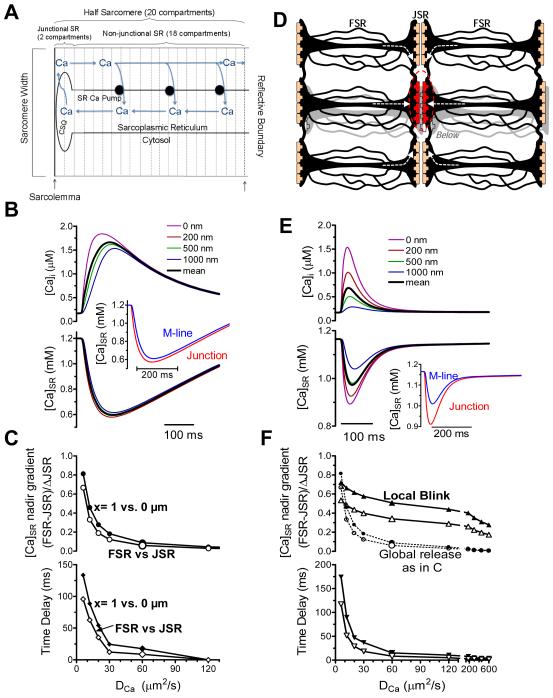
Fig 5. Mathematical model of [Ca]SR depletion during global & local SR Ca release.
A. Compartments in ECC model. Ca Release takes place in a half-sarcomere with reflective boundaries. B. Cytosolic (top) and SR (bottom) free [Ca] at varying distances from SR junction, with model driven by SR Ca release waveform.26 Inset shows mean data at junction and 1 μm away (±500 nm), simulating experimental data (Fig 1E). C. [Ca]SR gradient at nadir (top) and time delay to nadir at 1 μm vs. JSR over a range values. Filled symbols are for specific compartments, open symbols are compartment averages ±500 nm. D. Model geometry for release from a single red junction (see supplement Fig II). Arrows show how neighboring regions may supply Ca for release. E. Cytosolic and [Ca]SR profiles for release from a single junction in D. F. [Ca]SR gradient at nadir (top) and time delay to nadir at 1 μm relative to junction as in C. Top panel reproduces [Ca]SR gradients for ECC as in C (dotted).

