Figure 2.
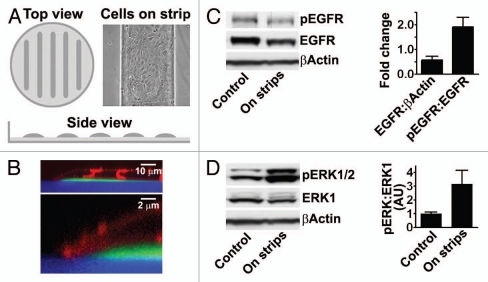
A model to determine the effects of free edges in epithelial cell sheets (cf. Fig. 1C).14 (A) Schematic of plates covered with polyHEMA and plastic strips. Light gray, polyHEMA; dark gray, plastic; inset, phase contrast microscopy of HCLE cells grown on plastic strips. (B) x–z section of a confocal image of HCLE cells at the edge of a plastic strip. The strips and poly-HEMA were labeled with fluorophores (green and blue, respectively), and the cells were labeled with the membrane dye Vybrant DiD (depicted in red). (C) Immunoblot of extracts with an antibody against EGFR phosphorylated on tyr-1173. The blots were stripped and reprobed with antibodies that recognize total amounts of the EGFR. The same blots were also probed with an antibody against β-actin as load control. (D) Immunoblot of extracts with an antibody against activated ER K1/2. The blots were stripped and reprobed with antibodies that recognize total amounts of the ER K1. The columns in (C and D) are means of six determinations ±SD.

