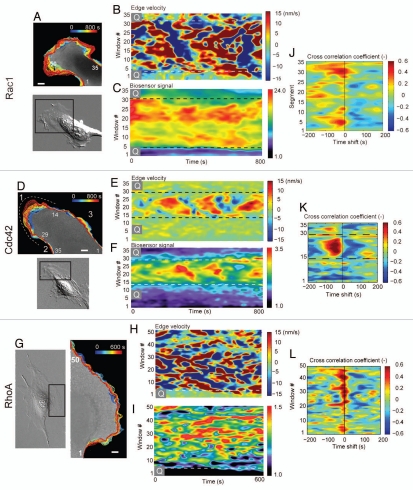
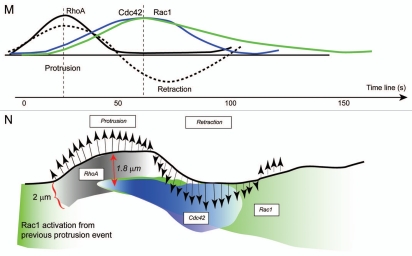
Figure 6.
Dynamics mapping and cross-correlational approach to determining the spatio-temporal coordination of GTPases (Taken from Machacek et al.).37 (A, D and G) Edge tracking of the leading edge protrusion/retraction, sampling window numbers 1 ∼ 35 are designated. Scale bar = 10 µm. Dynamics maps of the average velocity and Rac1 (B and C), Cdc42 (E and F) and RhoA (H and I) activities at the leading edge during random protrusion and retraction cycles of MEF/3T3 cells. (J–L) Cross-correlation coefficient distribution between the edge velocity map and the Cdc42 activity map is shown as a function of time shifts. (M) Reconstruction of Rho GTPase dynamics. Timing of Rac1, Cdc42 and RhoA activation relative to edge velocity, as determined with time-lag dependent cross-correlation coefficients; green line, edge movement correlation with Rac1; blue line, edge movement correlation with Cdc42; black line, edge movement correlation with RhoA; dashed lines, edge velocity. (N) Timing and location of GTPase activation during protrusion and retraction (not drawn to scale) determined from the cross correlation maxima and the auto correlation width. Green, Rac1 activation; black, RhoA activation; blue, Cdc42 activation.


