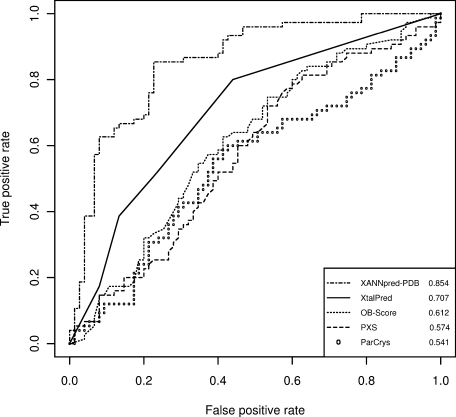
Figure 1.

ROC curves for XANNpred-PDB, XtalPred,20 OB-Score,19 PXS,16 and ParCrys21 on the blind test dataset TEST-PDB. XANNpred-PDB significantly outperforms the next best algorithm XtalPred (two-tailed P ≤ 0.0062). Areas under the ROC curves are given in the bottom right-hand corner. This figure was generated using the R package.42
