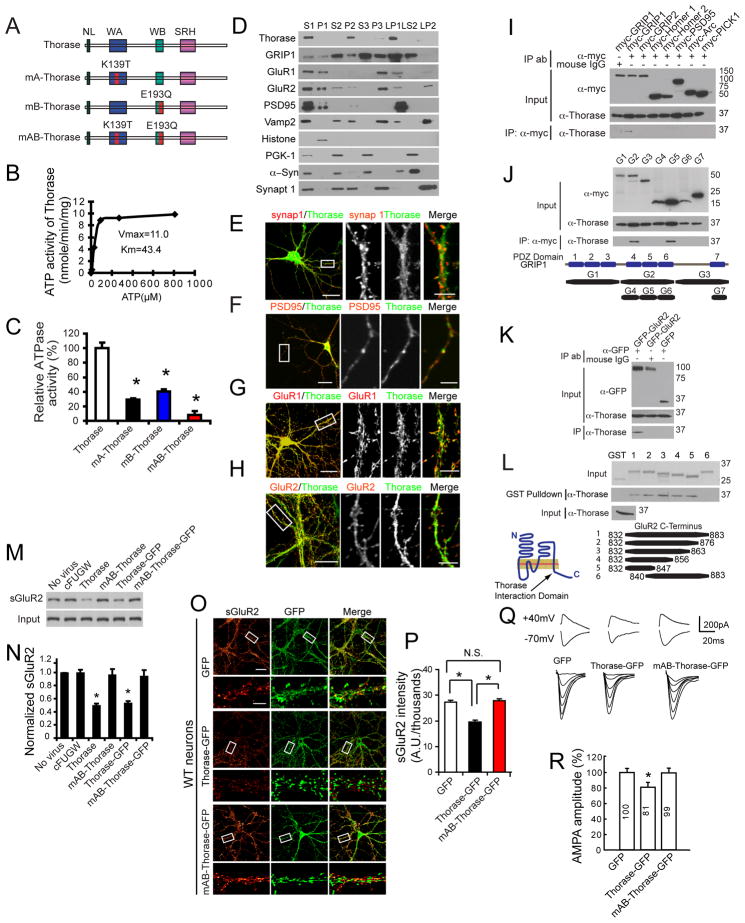
Figure 1. The AAA+ ATPase, Thorase is a Cytosolic and Postsynaptic Protein that Regulates AMPAR Surface Expression.
(A) Schematic diagrams of Thorase constructs. WT Thorase (Thorase), Thorase with a Walker A domain mutation (K139T) (mA-Thorase), Thorase with a Walker B domain mutation (E193Q) (mB-Thorase), and with Walker A and Walker B domains (mAB-Thorase). NL, N-linker; WA, Walker A; WB, Walker B; SRH, second region of homology.
(B) ATPase activity of WT Thorase. Vmax (nmole/min/mg protein) and Km (μM).
(C) Analysis of ATPase activities of Thorase mutants (mean ± S.E.M of 3 experiments performed in triplicate. n = 3. *p < 0.05, ANOVA with Tukey-Kramer post-hoc test).
(D) Subcellular distribution of Thorase. S1, supernatant of the homogenate at low-speed centrifugation; P1, nuclei and large debris of the corresponding pellet from S1; S2, supernatant of S1 subjected to medium-speed centrifugation; P2, crude synaptosomes of the corresponding pellet from S2; S3, cytosol, which corresponds to the supernatant of S2 subjected to high-speed centrifugation; P3, light membranes, corresponding pellet of S3; LP1, synaptosomal membranes; LS2, synaptic cytosol; LP2, synaptic vesicle-enriched fraction. α-Syn, α-Synuclein; synap 1, synaptophysin 1.
(E) Thorase juxtaposes with the presynaptic marker synapsin 1.
(F) Thorase colocalizes, in part, with the postsynaptic marker PSD95.
(G–H) Similar colocalizations with Thorase are also detected for GluR1 and GluR2. Scale Bar = 20 μM. High power images scale bars = 5 μM.
(I) Thorase interacts with immunoprecipitated (IP) myc-GRIP1, but not other myc-tagged synaptic proteins.
(J) Immunoprecipitated Thorase interacts with the PDZ5 domain of GRIP1. Corresponding protein regions of the fragments are depicted.
(K) Immunoprecipitated Thorase interacts with GFP-GluR2, but not GFP.
(L) GST pull-down assay indicates that Thorase binds to GluR2 residues 832–839 in the C-terminal tail. Coomassie stain of input GST fusion proteins, and anti-Thorase immunoblotting of Thorase input are also shown. The illustration depicts the binding region of Thorase on GluR2.
(M) Surface biotinylation assay for GluR2 surface expression in primary high-density cortical cultures infected with different Thorase lentiviruses as indicated. Lenti-cFUGW was used as a lentivirus control.
(N) Quantification of surface levels of GluR2 shown in (M). Student’s t-test. n = 3. *p < 0.05 when compared with cFUGW.
(O) Representative images of surface GluR2 expression in low-density hippocampal neurons infected with lentivirus expressing GFP, Thorase-GFP or mAB-Thorase-GFP. Surface GluR2 expression is shown using a Glow scale from black (zero) to red (low pixel intensity) and white (high pixel intensity). Scale Bar for low resolution images = 20 μm. Scale bar for high resolution images = 5 μm.
(P) Quantification of surface GluR2 expression shown in (O). Student’s t-test. n = 10–12 cells each group. *p < 0.01, when compared with neurons expressing GFP.
(Q) Representative traces of NMDA and AMPA currents of hippocampal CA1 neurons in slices from mice injected with lenti-GFP, lenti-Thorase-GFP and lenti-mAB-Thorase-GFP.
(R) Quantification of AMPA amplitudes of hippocampal CA1 neurons in slices from mice injected with lenti-GFP, lenti-Thorase-GFP and lenti-mAB-Thorase-GFP. n = 5 neurons from 3 different animals for each experimental group, Student’s t-test, *p < 0.05 when compared with lenti-GFP.
See also Figure S1.

